


Abuja, Nigeria
The analysis of the report of the Value Added Tax (VAT) for the first quarter of 2025 shows that Lagos State outperformed the rest of the 35 states combined in generation and remittances.
DailyAgent Analytics analysis revealed that Lagos’s contribution to the VAT pool was N819.62bn while the rest 35 states contributed a total of N660.40bn.

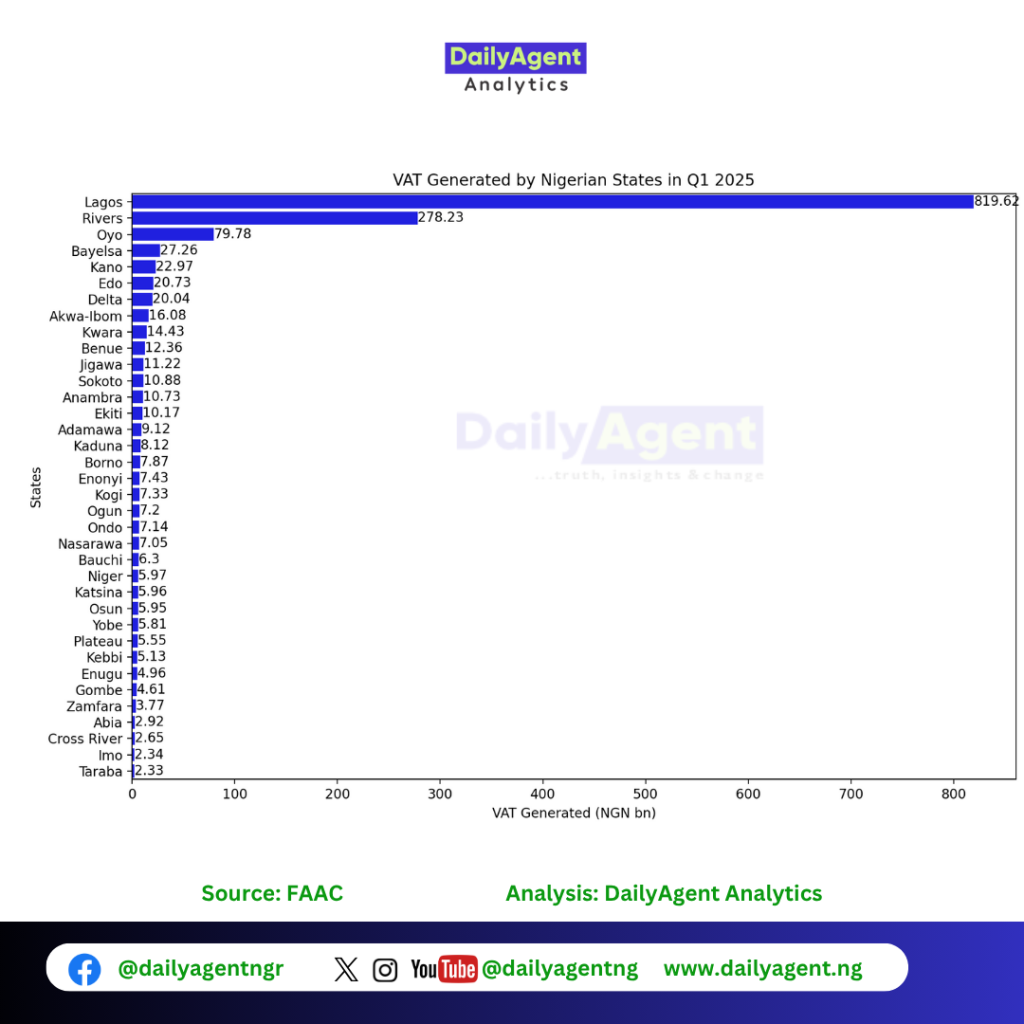
This visualisation provides a clear comparison of VAT contributions across the states, highlighting which states generated the most revenue during Q1 2025.
Regional Contribution to VAT Pool
In Q1 2025, the South West region, comprising Lagos, Oyo, Ogun, Ondo, Ekiti and Osun, has the highest contribution, followed by the South South, comprising Akwa Ibom, Bayelsa, Cross River, Delta, Edo, and Rivers.
North West regions, comprising Jigawa, Kaduna, Kano, Katsina, Kebbi, Sokoto, and Zamfara, came third and followed by the North Central, comprising Benue, Kogi, Kwara, Nasarawa, Niger, Plateau.
The regions with the least contribution include the North East, comprising Adamawa, Bauchi, Borno, Gombe, Taraba, and Yobe. and the South East regions, comprising Anambra, Enugu, Imo, Ebonyi and Abia..
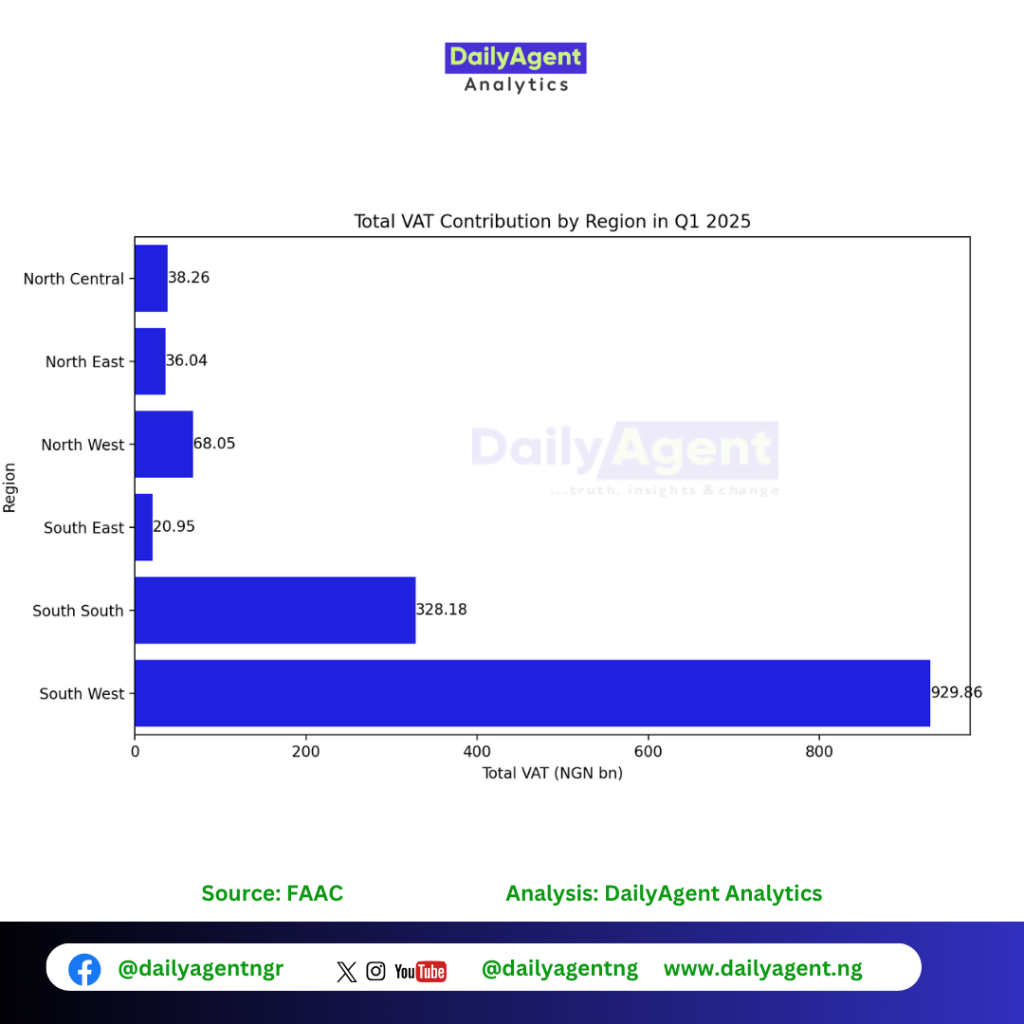
South West region as the highest contributor, followed by the South South and North West regions.
VAT Contribution Vs Receipt at Regional Levels
All other regions except the South West received less than what they contributed to the VAT pool.
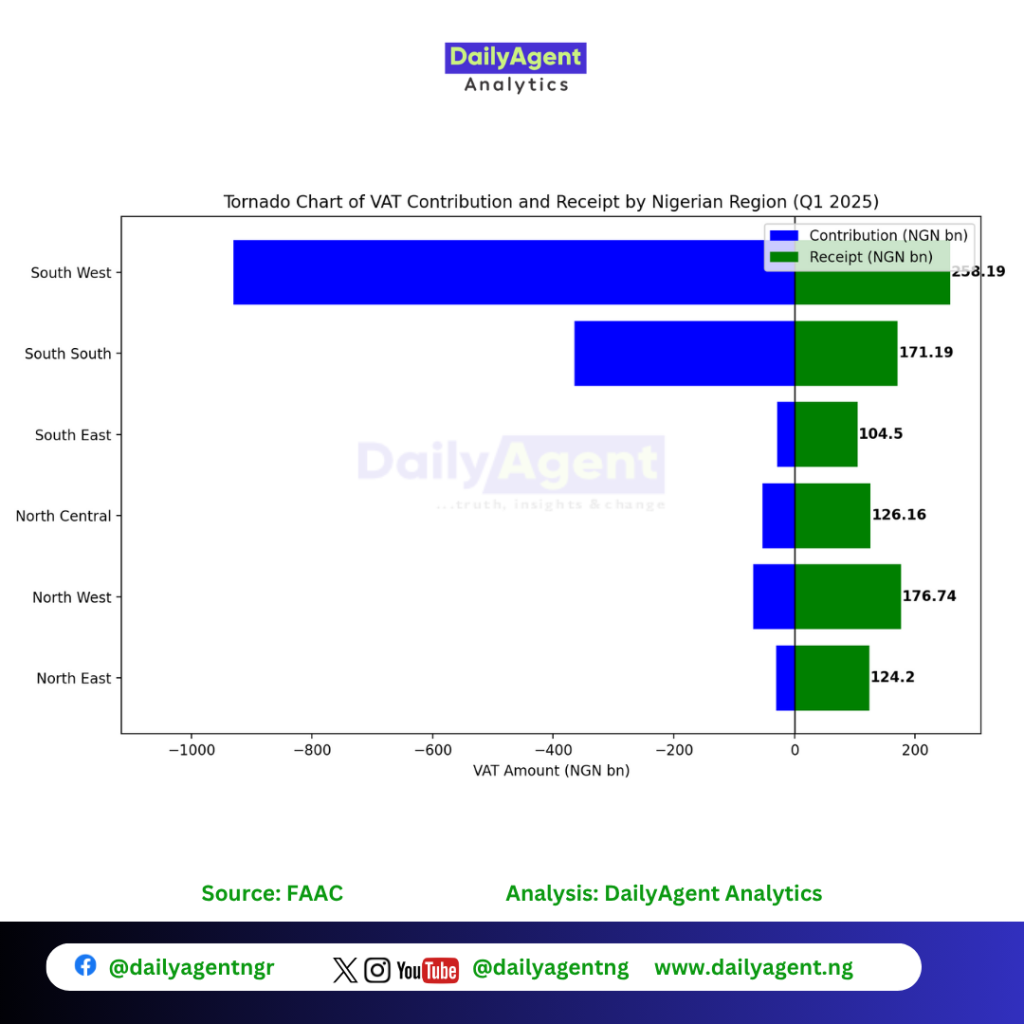
We plotted a tornado chart showing the amount of VAT generated in each zone (“Contribution”) versus the amount received by each zone (“Receipt”) through the monthly Federation Account Allocation Committee (FAAC).
The chart features:
- Blue bars (extending left): VAT contributions by each region, with values annotated in white text.
- Green bars (extending right): VAT receipts by each region, with values annotated in black text.
- Clear annotations: Each bar shows the exact amount in NGN billion.
According to the tornado chart, the redistribution pattern of VAT across Nigeria’s regions is as follows:
- South West: Contributes the highest (929.87 bn) but receives far less than its contribution (258.19 bn).
- South South: Contributes the most (364.99 NGN bn) but receives much less (171.19 NGN bn)
- North West: Moderate contribution (68.05 NGN bn) but receives significantly more (176.74 NGN bn).
- North Central: Contributes 52.7 NGN bn and receives 126.16 NGN bn
- North East: Lower contribution (30.04 NGN bn) but receives much more (124.2 NGN bn)
- South East: Lowest contribution (28.37 NGN bn) but receives 104.5 NGN bn
This visualisation effectively demonstrates how the Nigerian current VAT system redistributes resources from high-contributing regions to other regions across the country.